Working with large assemblies in SOLIDWORKS can be very challenging — and even frustrating — if you’re not familiar with some basic large assembly performance improvement techniques. If you’ve worked on a large assembly with 500 or more parts, you’re likely familiar with the software slowdowns and even crashes that can come with these larger assemblies. Luckily, there are several techniques you can employ to improve performance in SOLIDWORKS when dealing with these large assemblies.
What is a large assembly?
The term “large assembly” is subjective, and you’ll probably see it defined differently from one person to the next. For example, let’s say Company A is used to building fairly small assemblies of 10 or so components. To Company A, an assembly of 50 parts might be considered a large assembly. Now, consider Company B, where most of their products are assemblies of 300 or more parts. To Company B, an assembly of 50 parts might be considered a small assembly.
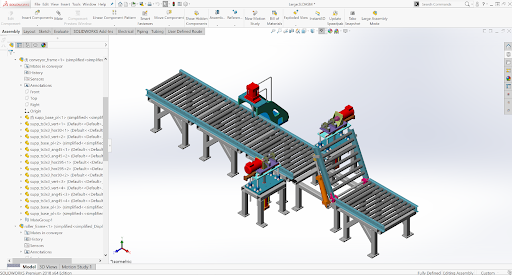
Generally speaking, a large assembly is defined as an assembly in which you start to see slowdowns in your system. Maybe SOLIDWORKS becomes slow and starts to lag. Perhaps it takes a long time to open or save the assembly. Or, you experience frequent crashes that you’re not used to seeing with other assemblies.
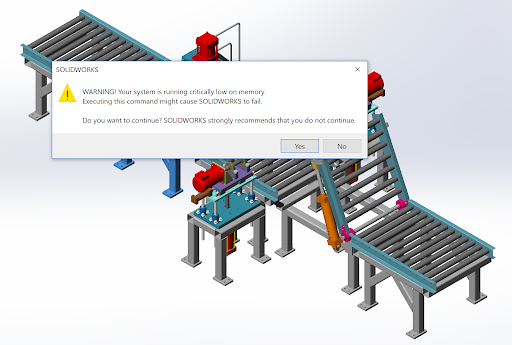
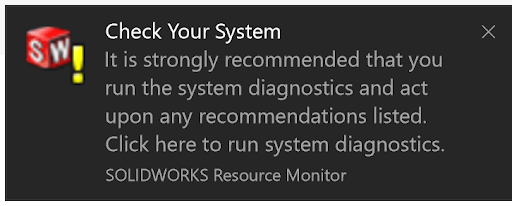
It should be fairly obvious if your system is running slowly, but SOLIDWORKS also provides several warnings to let you know when you might be running low on computer resources. I’ve included some examples of warning messages in Fig. 2 and Fig. 3.
Why is large assembly performance an issue?
If you have a large assembly, SOLIDWORKS will need to use most, or all, of your system’s resources, which will then slow down your system. The solution could be as simple as getting a slightly more powerful computer. However, even if you use a top-of-the-line CAD machine, you will eventually hit your system resource limits and the system will slow down.
Use the Performance Evaluation Command and Assembly Visualization tool
A great tool to use during system slowdowns is the Performance Evaluation Command, which you can find under the Evaluate tab. This command analyzes the performance of assemblies and suggests actions you can take to help improve performance.
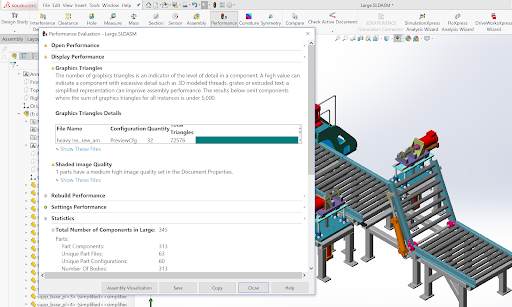
The Performance Evaluation tool provides great insight into potential performance issues within an assembly, including file opening performance, display performance, rebuild performance, and much more. For example, in Fig. 4, you can see the assembly has 345 components, and the Display Performance shows which components might be causing performance issues. At the top of the list, it shows that the component “heavy hex flange screw_am” is consuming the most display resources.
Within the Performance Evaluation window, there’s also a button for Assembly Visualization, a tool for visualizing assembly components by specific custom properties. This tool can help you find problem components or determine the weakest link in an assembly with respect to performance.

For example, Fig. 5 shows an Assembly Visualization sorted by Total Graphics Triangles, a good indicator of what might be causing display performance issues. The tool explains that the “heavy hex flange screw_am” seems to be display heavy, and it gives a nice sorting of components by color. In this case, the components with high graphics triangles are shown in red versus blue.
Check component image quality
Once you’ve determined that a specific component — or few components — might be causing display issues, you need to improve the performance of those components. One of the first things to check is the component image quality.
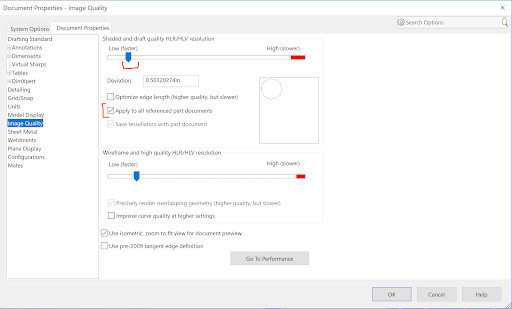
Within the assembly, navigate to System Options > Document Properties > Image Quality. From there, change the resolution settings and apply the changes to all referenced parts within your assembly. The lower resolution will improve performance while increasing the display resolution, which might be great for final image renders but will slow down your system. In many cases, large assembly performance issues can be fixed this easily! Even if a single part within your assembly has the resolution setting quite high, you can easily run into performance issues.
Insider tip: Component image quality is generally one of the first things to check when dealing with performance issues.
Turn on Large Assembly Mode
Large Assembly Mode is a collection of system settings that improve the performance of assemblies. To help improve the overall performance, it essentially turns off a number of display and performance settings that are usually computationally expensive to run. For example, shadows, RealView graphics, and the dynamic highlight are automatically turned off in Large Assembly Mode. You can turn on Large Assembly Mode any time by navigating to Tools > Large Assembly Mode.
Simplify your configuration with the SpeedPak functionality
You can use the SpeedPak functionality to create a simplified configuration of an assembly without losing references. Think of it this way: A SpeedPak configuration is essentially a subset of the assembly. However, unlike regular configurations where you simplify an assembly by suppressing components, SpeedPak simplifies without suppressing. So, these simplified components can still be seen visually but cannot be edited or selected directly within the simplified assembly. The full geometry is replaced with a graphical representation of the external faces.
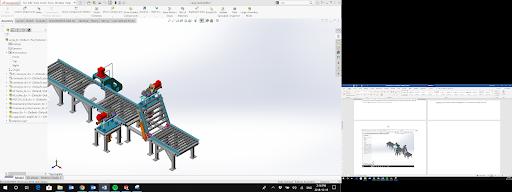
For example, Fig. 7 shows a large assembly where a SpeedPak has been applied to the conveyor components. All motor components are still given in their full graphical representation; however, the conveyor components are simplified representations. Hovering over these simplified subassemblies creates a “ghost” effect, where you can see through the simplified components.
For a complete list of ways to improve your large assembly performance, download our e-guide, “Work Smarter, Not Harder: Your Quick Fix Guide to Managing Large Assemblies“.


